IHS Automotive forecasts that Brazil will almost break even this year, as more vehicles are localized
With sales and production falling at a fast pace, Brazil has been making an effort to increase exports. However, developing export markets is never an easy and fast task, and the government has been trying to sign more FTAs (free trade agreements) to help the industry. In a way, that is a paradox for a country that has closed its borders and that has always seen its local demand reason enough to attract OEMs.
In 2012, Brazil increased the IPI (tax on industrialized products) on imported vehicles, excluding those made in the Mercosul countries and in Mexico, by 30 percentage points.
That has changed the market, to imported brands despair. Kia’s market share, for example, plunged to 0.7% last year from 2.3% in 2011. JAC went to 0.3% from 1.1% and Chery fell to 0.3% from 0.9%. But do not think that the main makes were the ones that benefited the most. Between 2011 and 2014, Fiat was able to retain its share in 21% range, but Volkswagen lost 2.6 percentage points. Chevrolet became the second most popular brand in 2014, but with a lower market share: 17.4% from 18.4% in 2011.
Hyundai was the brand that enjoyed the largest gain, but because of the locally-built HB20 – which is not built anywhere else in the world. Registrations of imported Hyundai models collapsed 50.4%. Toyota was the other make that grew the most, in this case thanks to the Etios. Toyota’s entry in the B-segment was made in India, but never imported to Brazil. In other words, the brands that grew the most while Brazil was closing its borders did not benefit from trade barriers.
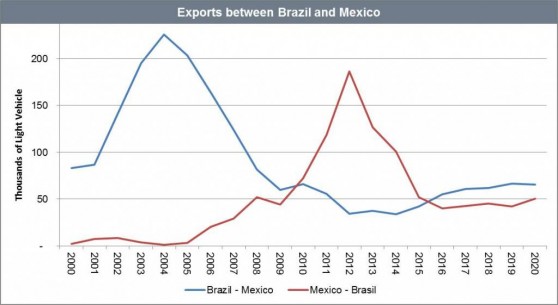
Also in 2012, Brazil and Mexico established quotas in lieu of a full FTA. Brazil exported more cars to Mexico than the other way around between 2000 and 2009, although Mexico started closing the gap in 2005. In 2011, the Brazilian deficit (in units exported/imported) skyrocketed 937.6%, to 62,753 light vehicles. The governmental red light did not prevent the difference from soaring another 141.7% in 2012, to 151,694 units.
With quotas in place and the localization of some vehicles previously imported from Mexico, such as the Ford Fiesta and the Nissan March, the deficit went to 67,365 units last year. IHS Automotive forecasts that Brazil will almost break even this year, as more vehicles are localized – the Volkswagen Golf and Jetta and the Nissan Versa began production in Brazil this year. Our outlook is for a surplus next year, when we assume the Volkswagen up! and the Jeep Renegade, among others, will be exported to Mexico.
It is interesting to note that the quotas are based on dollar amounts, while the recently announced FTA with Colombia uses units. Brazil exports to Mexico more vehicles in the lower-end of the market, while Mexico exports more expensive cars. Volkswagen, for example, exports the Gol to Mexico – a vehicle that costs between USD8,000 and USD15,000 in Brazil – but imports the most expensive trim level of the Jetta, for which it charges USD24,900 in Brazil.
There is no doubt that the barriers imposed in 2012 helped Brazil to slow down the pace of imported vehicles. The problem is that the local market is likely to close 2015 below 2.5 million units from the record high of 3.6 million in 2012, so Brazil has to deal with the extra capacity that it added in the last couple of years.
All this comes as the government desperately seeks a fiscal balance and has reduced benefits to exporters. The return on taxes paid on exported goods has already fallen to 1% from 3% and will shrink to 0.1% in December. It will start recovering in 2017 to 1%, in 2018 to 2%, and in 2019 to 3%. Another Brazilian paradox.
Augusto Amorim is senior analyst, South American light vehicle production forecast, IHS Automotive
Copyright © 2025 S&P Global Inc. All rights reserved.
These materials, including any software, data, processing technology, index data, ratings, credit-related analysis, research, model, software or other application or output described herein, or any part thereof (collectively the “Property”) constitute the proprietary and confidential information of S&P Global Inc its affiliates (each and together “S&P Global”) and/or its third party provider licensors. S&P Global on behalf of itself and its third-party licensors reserves all rights in and to the Property. These materials have been prepared solely for information purposes based upon information generally available to the public and from sources believed to be reliable.
Any copying, reproduction, reverse-engineering, modification, distribution, transmission or disclosure of the Property, in any form or by any means, is strictly prohibited without the prior written consent of S&P Global. The Property shall not be used for any unauthorized or unlawful purposes. S&P Global’s opinions, statements, estimates, projections, quotes and credit-related and other analyses are statements of opinion as of the date they are expressed and not statements of fact or recommendations to purchase, hold, or sell any securities or to make any investment decisions, and do not address the suitability of any security, and there is no obligation on S&P Global to update the foregoing or any other element of the Property. S&P Global may provide index data. Direct investment in an index is not possible. Exposure to an asset class represented by an index is available through investable instruments based on that index. The Property and its composition and content are subject to change without notice.
THE PROPERTY IS PROVIDED ON AN “AS IS” BASIS. NEITHER S&P GLOBAL NOR ANY THIRD PARTY PROVIDERS (TOGETHER, “S&P GLOBAL PARTIES”) MAKE ANY WARRANTY, EXPRESS OR IMPLIED, INCLUDING BUT NOT LIMITED TO ANY WARRANTIES OF MERCHANTABILITY OR FITNESS FOR A PARTICULAR PURPOSE, FREEDOM FROM BUGS, SOFTWARE ERRORS OR DEFECTS, THAT THE PROPERTY’S FUNCTIONING WILL BE UNINTERRUPTED OR THAT THE PROPERTY WILL OPERATE IN ANY SOFTWARE OR HARDWARE CONFIGURATION, NOR ANY WARRANTIES, EXPRESS OR IMPLIED, AS TO ITS ACCURACY, AVAILABILITY, COMPLETENESS OR TIMELINESS, OR TO THE RESULTS TO BE OBTAINED FROM THE USE OF THE PROPERTY. S&P GLOBAL PARTIES SHALL NOT IN ANY WAY BE LIABLE TO ANY RECIPIENT FOR ANY INACCURACIES, ERRORS OR OMISSIONS REGARDLESS OF THE CAUSE. Without limiting the foregoing, S&P Global Parties shall have no liability whatsoever to any recipient, whether in contract, in tort (including negligence), under warranty, under statute or otherwise, in respect of any loss or damage suffered by any recipient as a result of or in connection with the Property, or any course of action determined, by it or any third party, whether or not based on or relating to the Property. In no event shall S&P Global be liable to any party for any direct, indirect, incidental, exemplary, compensatory, punitive, special or consequential damages, costs, expenses, legal fees or losses (including without limitation lost income or lost profits and opportunity costs or losses caused by negligence) in connection with any use of the Property even if advised of the possibility of such damages. The Property should not be relied on and is not a substitute for the skill, judgment and experience of the user, its management, employees, advisors and/or clients when making investment and other business decisions.
The S&P Global logo is a registered trademark of S&P Global, and the trademarks of S&P Global used within this document or materials are protected by international laws. Any other names may be trademarks of their respective owners.
The inclusion of a link to an external website by S&P Global should not be understood to be an endorsement of that website or the website's owners (or their products/services). S&P Global is not responsible for either the content or output of external websites. S&P Global keeps certain activities of its divisions separate from each other in order to preserve the independence and objectivity of their respective activities. As a result, certain divisions of S&P Global may have information that is not available to other S&P Global divisions. S&P Global has established policies and procedures to maintain the confidentiality of certain nonpublic information received in connection with each analytical process. S&P Global may receive compensation for its ratings and certain analyses, normally from issuers or underwriters of securities or from obligors. S&P Global reserves the right to disseminate its opinions and analyses. S&P Global Ratings’ public ratings and analyses are made available on its sites, www.spglobal.com/ratings (free of charge) and www.capitaliq.com (subscription), and may be distributed through other means, including via S&P Global publications and third party redistributors.